Introduction
Future Coastal Floodplain Mapper for Lower New York State:
Explore how sea level rise will change coastal flooding
Since much of New York State’s coast is highly developed and populated, it is important to understand and plan for projected increases in sea level. Tidally influenced areas in New York State have experienced at least a foot of sea level rise since 1900. State projections estimate that sea levels will increase between 0.5 to 2 feet by 2050.
NYSERDA has developed data resources for a range of future coastal flooding conditions in order to improve the ability of local and state officials, and others to assess vulnerability and inform resiliency planning. The table below provides estimated sea level rise projections by decade under low, median, and high scenarios and are representative of sea level rise projections found in the 2014 Supplement to the ClimAID Integrated Assessment for Effective Climate Change Adaptation. The Coastal New York Future Floodplain Mapper provides information for seven of these scenarios (12, 18, 24, 36, 48, 60, and 72 inches).
| Sea Level Rise |
Low-end Scenario |
Median Scenario |
High-end Scenario |
| Inches |
Year |
Year |
Year |
| 0 |
1992 |
1992 |
1992 |
| 6 |
2030s |
2020s |
2010s |
| 12 |
2070s |
2040s |
2020s |
| 18 |
>2100 |
2050s |
2030s |
| 24 |
>2100 |
2070s |
2040s |
| 30 |
>2100 |
2080s |
2050s |
| 36 |
>2100 |
2090s |
2060s |
| 48 |
>2100 |
>2100 |
2070s |
| 60 |
>2100 |
>2100 |
2080s |
| 72 |
>2100 |
>2100 |
2090s |
Expected decades for each sea level rise scenario, based on low-end (10th-percentile), median, and high-end (90th-percentile) sea level rise projections over NOAA’s 1983-2001 mean sea level datum. Bold values represent scenarios available in the Mapper.
Viewer Geography:
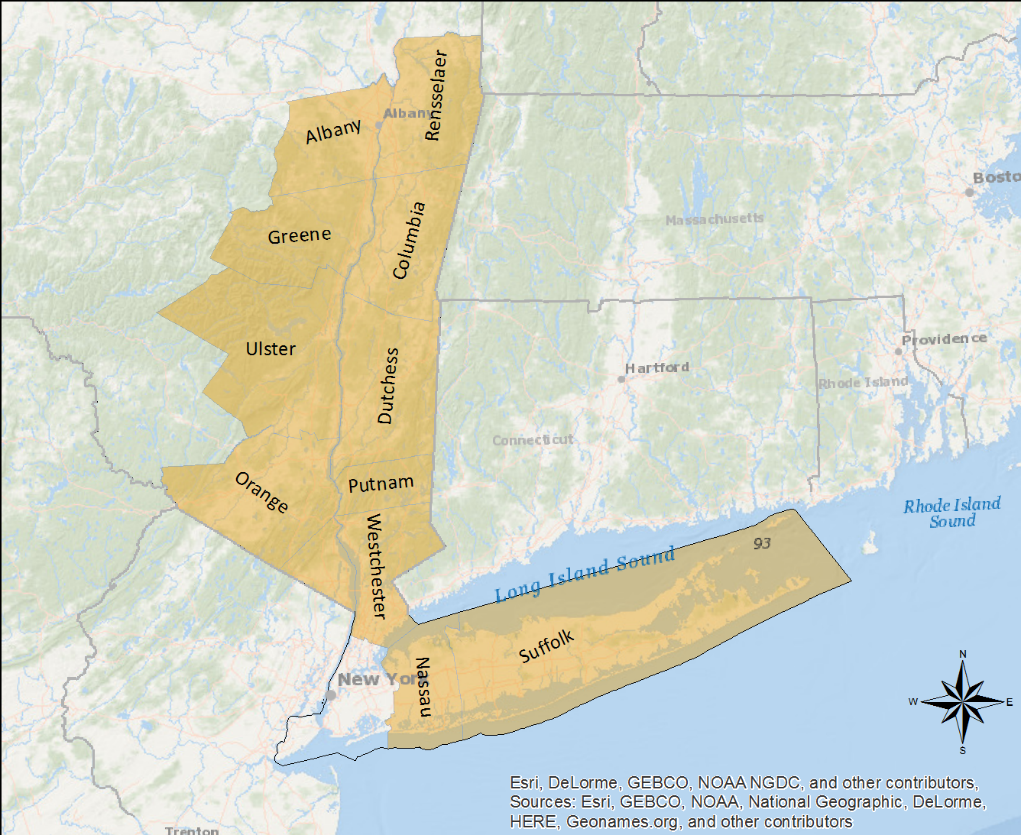
The Coastal New York Future Floodplain Mapper covers the tidally influenced shoreline of New York State, with the exception of New York City. Data layers include the following counties:
| Counties in Mapper |
| Albany |
Putnam |
| Columbia |
Rensselaer |
| Dutchess |
Rockland |
| Greene |
Suffolk |
| Orange |
Ulster |
| Nassau |
Westchester |

Overview of Viewer Contents:
The Mapper provides the following flood hazard information for each sea level rise scenario:
Future Coastal Floodplain Extents and Summaries: These map layers show the extent of coastal flooding for the 10-, 50-, 100-, and 500-yr flood events (i.e., flood recurrence interval) for each sea level rise scenario. Community- and county-based summaries of the changes in flood extent for each scenario and coastal flood recurrence interval are also provided.
Notes on tidal flooding: The Mapper provides a description of projected future flooding due to coastal storm surge and sea level rise. Users interested in map data describing future permanent inundation and/or tidal flooding under sea level rise without storm surge should refer to the NOAA SLR Viewer.
Extent of Structurally Damaging Wave Action: Depicts the areas that have potential for breaking wave heights over 1.5 ft, for the 100-year recurrence interval under each sea level rise scenario. Structures subject to these wave conditions are likely to experience structural damage in the case of a 100-yr recurrence interval event. Areas within this shaded zone correspond to the Area of Moderate Wave Action, or the Coastal High Hazard Zone (VE) as defined by FEMA. This extent corresponds with the “coastal risk management zone” as identified in the New York State Sea Level Rise Task Force Report.
Building Exposure: Summary counts of buildings vulnerable to coastal flooding and wave action for each selected sea level rise scenario and coastal flood recurrence interval, by community and county. Building exposure is only provided for areas where building footprint data were available. These include the following counties:
| County Name |
| Dutchess |
| Nassau |
| Orange |
| Rockland |
| Suffolk |
| Ulster |
| Westchester |
Chance of Flooding: The percent chance of flooding over a 30-year timeframe for the selected scenario. Provided values are averages for the chosen community/county. The presented value reflects change in flood probability based solely on the increase in flood depth due to each sea level rise scenario.
Data Sources:
The following data sources were used to produce the coastal flood hazard information in the Coastal New York Future Floodplain Mapper:
| Albany, Columbia, Dutchess, Green, Orange, Putnam, Rensselaer, Rockland, Ulster and Westchester Counties |
| Topography |
Flood Hazard Data |
| 2012 (Pre-Sandy) LiDAR-derived DEMs |
FEMA Region II Coastal Storm Surge Study (2014) |
| Nassau County |
| Topography |
Flood Hazard Data |
2012 (Pre-Sandy) LiDAR-derived DEMs
Supplemented with 2009 LiDAR outside of 2012 LiDAR footprint
|
2009 FEMA Flood Insurance Study |
| Suffolk County |
| Topography |
Flood Hazard Data |
2012 (Pre-Sandy) LiDAR-derived DEMs
Supplemented with 2006 LiDAR outside of 2012 LiDAR footprint.
|
2009 FEMA Flood Insurance Study |
For more information on how the data was created, please contact NYSERDA.
Tutorial:
Additional Information:
The ClimAID Report—Climate Scenarios for New York State
New York State Department of Environmental Conservation: Climate Change and Adaptation Resources
New York Climate Change Science Clearinghouse